
Article Options
- Subscribe to RSS Feed
- Mark as New
- Mark as Read
- Bookmark
- Subscribe
- Email to a Friend
- Printer Friendly Page
- Report Inappropriate Content
A key part of
mobilizing the enterprise is about bringing data reports and analysis to
the edge of the network. That’s why I was so delighted to learn
about AChartEngine open source software. It is a freely-available
library which can be linked with your apps to produce beautiful
graphical output in the form of customizable graphs and charts.
You can find AChartEngine at http://www.achartengine.org. It uses the Apache Version 2 license, which is business-friendly and does not require redistribution of any modified sources or linked binaries.
The documentation is in the form of Javadoc pages explaining the API. There is also a sample project, and the source code itself. The sample project, the library jar files and the Javadocs are at http://code.google.com/p/achartengine/downloads/list . The source code is maintained at http://achartengine.googlecode.com/svn/trunk/.
Here’s a simple pie chart that I built using AChartEngine. It’s a pie chart showing some of my favorite local taverns in Silicon Valley - a pie chart of bars, if you like.
The documentation is in the form of Javadoc pages explaining the API. There is also a sample project, and the source code itself. The sample project, the library jar files and the Javadocs are at http://code.google.com/p/achartengine/downloads/li
Here’s a simple pie chart that I built using AChartEngine. It’s a pie chart showing some of my favorite local taverns in Silicon Valley - a pie chart of bars, if you like.
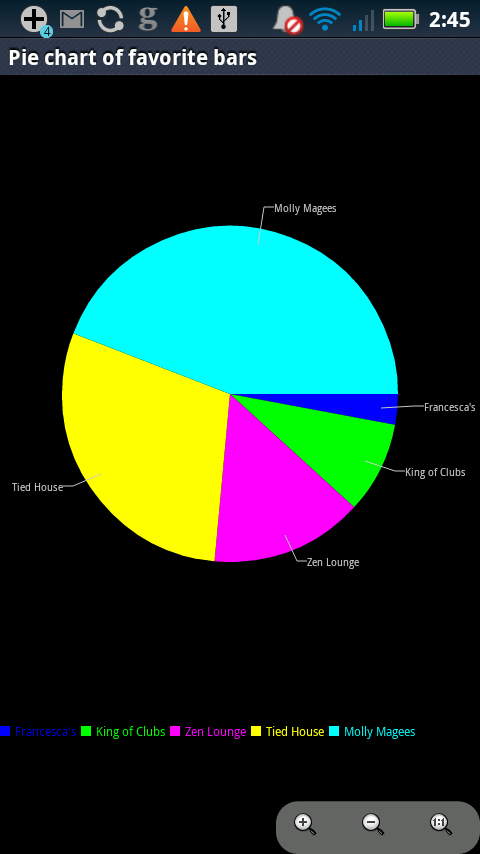
Figure 1: a pie chart of my favorite bars
As you can see, I like Molly Magees best, with the Tied House brewpub a close second. I hardly ever visit Francesca’s. I created this chart with about one dozen lines of code. You can find several instructional videos on YouTube by searching for “AChartEngine”, and the basic steps are these:
- do the one time setup in your Eclipse project - create a library
folder, put the achartengine jar file into it, and add that jar file to
your project build path. Add
<activity android:name="org.achartengine.GraphicalActivity"/
> to the manifest file. - Create and initialize 3 arrays, one each for the colors, label strings, and slice sizes of your pie chart
- Create a “CategorySeries” object that will hold the strings and relative pie sizes. Load these strings and size values into the CategorySeries object. The graphing library takes all its data from Series objects that you give it.
- Create a “DefaultRenderer” object, and use it in the next step. CategorySeries and DefaultRenderer are types defined in AChartEngine.
- For each color in the chart, create a SimpleSeriesRenderer, and set it to your chosen color. Add each SimpleSeriesRenderer to the DefaultRenderer. There is one Renderer for each Series. As here, the Renderer may contain other Renderers for its subpieces.
- Create a PieChartIntent that holds the CategorySeries and the DefaultRenderer
- Fire off the PieChartIntent to get your graph drawn. Your graph is drawn as a separate Activity.
Here is the code I whipped up to do these steps.
package com.example.bars;

import org.achartengine.ChartFactory;
import org.achartengine.chart.PieChart;
import org.achartengine.model.CategorySeries;
import org.achartengine.renderer.DefaultRenderer;
import org.achartengine.renderer.SimpleSeriesRenderer;
import android.content.Context;
import android.content.Intent;
import android.graphics.Color;
import android.app.Activity;
import android.os.Bundle;

public class MainActivity extends Activity {

    @Override
    public void onCreate(Bundle savedInstanceState) {
   	super.onCreate(savedInstanceState);
      	Intent intent = buildIntent();
    	startActivity(intent);          // step 7
    }

    public Intent buildIntent() {
   	 int[] values = new int[] { 5, 15, 25, 50, 75 };        // step 2
   	 String[] bars = new String[] {"Francesca's",  "King of Clubs",
                                 "Zen Lounge", "Tied House", "Molly Magees"};
   	 int[] colors = new int[] { Color.BLUE, Color.GREEN, Color.MAGENTA,
                                   Color.YELLOW, Color.CYAN };

   	 CategorySeries series = new CategorySeries("Pie Chart");  // step 3
   	 DefaultRenderer dr = new DefaultRenderer();   // step 4

   	 for (int v=0; v<5; v++){    // step 5
   		 series.add(bars[v], values[v]);
   		 SimpleSeriesRenderer r = new SimpleSeriesRenderer();
   		 r.setColor(colors[v]);
   		 dr.addSeriesRenderer(r);
   	 }
   	 dr.setZoomButtonsVisible(true);
   	 dr.setZoomEnabled(true);
   	 dr.setChartTitleTextSize(20);
   	 return ChartFactory.getPieChartIntent(    // step 6
                              this, series, dr, "Pie of bars");
    }

}
I think you’ll agree that is an excellent pie chart for a very small investment of code. There is a youtube video on the one time setup at http://www.youtube.com/watch?v=9xdp7Ay19BQ .
Enterprise developers usually want to standardize their tools as much as possible. While there isn’t a version of AChartEngine for other mobile platforms, since it is open source, there could be, if any public-spirited developer wants to retarget it. IT groups frequently use Microsoft Excel to create charts and graphs. AChartEngine doesn’t have any special support for importing data from Excel or from a cloud server. The developer, Dan Dromereschi, explained that he designed ACE with the goal that it should do one thing and do it well, and that one thing is charting. Some users have also commented favorably on the fact that the library does not need an internet connection to work. So it’s your job to get the data onto the device, then the software will graph it for you.
If you’re interested in working on AChartEngine, email Dan at contact@achartengine.org. Come on back to this blog in a few days time, and I’ll show another code example for drawing a different kind of AChartEngine graph.
What solution are you currently using to draw graphs in your Android apps? Please follow up with a post describing your thoughts.
Peter van der Linden
Android Technology Evangelist
Comments